Quantitative Analysis: Personal Data Sticker
 Image Credit: Snapchat, Inc. on Screen Rant
Overview
My Role: User Researcher working under a leading researcher
Methods: Survey, R, Factorial design, Factorial Analysis, and Literature review
Data Sources: Literature review and resulting survey
Deliverables: Research report describing users’ perceptions of social media stickers containing personal informatics
Tools: R Studio, JSON, Windows Powershell, Photoshop, and Google Doc
Background/Context: When people set health and behavior goals such as training for a half-marathon, going to bed earlier, or losing weight, they often use social media to share their progress with friends and family (Munson, 2012). Epstein et al. (2015) identified that many people share personal informatics data to receive advisory information, emotional support, motivation, or accountability from their audience. However, prior research has shown that sharing this data on social media generally doesn’t not result in the users’ desired outcomes.(Epstein, 2019).
Project Overview: I explored design principles for incorporating users’ step counts, one of the most commonly-tracked and shared pieces of personal informatics, into stickers in preparation for creating a similar feature for use in Snapchat posts or Instagram Stories.
Table of Contents
Objective
When users send or receive Snapchat stickers containing their personal step count data, what factors influence the users’ perceptions of those stickers? And how do these factors actually impact the users’ perceptions?
Opportunity and Process
Opportunity
In Snapchat or Instagram stories, people are able to use stickers to customize their posts for informative, aesthetic, or entertainment purposes. Available stickers are organized in a variety of categories depending on their content, format, style, etc. Currently, these stickers include methods for sharing some types of data, but the data is rarely about the user themself and instead typically pertains to the user’s location or surroundings. (Habib et al., 2019). This gives me an opportunity to design a series of stickers to support more types of user-generated content focused on users’ reasons for sharing.
Process
Through a review of research on multimedia and online advertising, I identified a series of predictors that may influence Snapchat users’ perceptions of stickers. I also determined the evaluation metrics for measuring these user perceptions. My team then designed a series of stickers for Snapchat that contain personal data about step counts. Finally, I conducted an online survey to determine how those stickers’ designs influenced users’ perceptions.
Strategy
Experiment Design
I used a factorial study design to evaluate varying levels of context, presentation, and style’s influence on participant perception and preference. After they consented to participate in the study, participants were asked to identify one person who they frequently Snap with to imagine as their conversation partner. They then gave feedback on six (6) randomly generated posts featuring data-driven stickers, answering some demographic questions upon completion.
The post generated varied on three dimensions:
Presentation styles
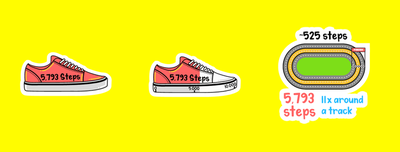
- Badge style annotates objects with the specific tracked value, for example a shoe or ribbon with “5,793 steps” written on it.
- Embellished style presents common objects as charts, picking one dimension to be the axis and shading the object partway according to the tracked value.
- Analogy style re-expresses tracked values as better-known quantities through comparisons.
Relevance levels
- Domain-relevant Domain-relevant designs use objects or comparisons specifically related to steps, such as snicker, track field.
- Domain-irrelevant Domain-irrelevant designs use well-known objects and comparisons that are not commonly associated with steps, such as a star or a speedometer.
Background styles
- Background of the post is a photo of specific scenario
- Background is from public CSS patterns with abstract shapes
| Domain-relevant | Domain-irrelevant | |
|---|---|---|
| Badge |  |  |
| Embellished | 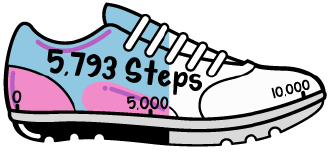 | 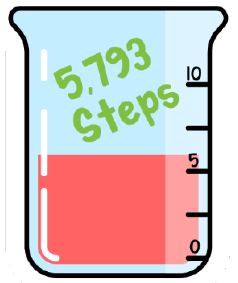 |
| Analogy | 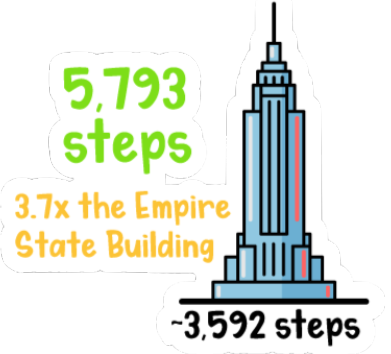 | 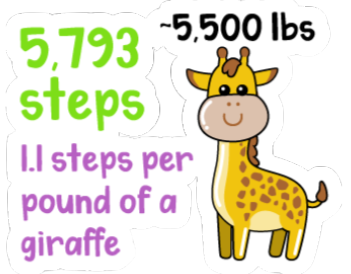 |
User Perception measurements
Participants answered questions from four widely-used scales from online marketing and advertising literature, modified to this context. The validated scale measures:
Entertainment Value: how entertaining the shared content is
Attitude: attitude toward the content
Intention to use: How inclined a user find to use this feature
Information Value: how informative a user find receiving the content
Privacy Considerations: how invasive the a user find sharing the content
Participants answered each question on a 7-item Likert scale with endpoints “Strongly Disagree” and “Strongly Agree”.’
Survey Sampling and Participant Screening
I used convenience sampling to gather information on adult Snapchat users’ opinions of the stickers. I sent out recruitment emails to a student research subject list, and distributed flyers with a survey link in university classrooms and meetings.
Only participants who were at least 18 years of age and who, on average, sent or viewed at least one post on Snapchat per week were chosen to participate in the study
Outcomes
The regression analysis showed that:
Users’ perceptions of stickers they’ve received correlated more significantly with our independent variables, compared with sharers’ perceptions.
And that influence that factors have on the two sides – Sharer and Recipient – are not received equally.
When the relevance of stickers’ presentations changes from irrelevant to relevant, the ratings increase in both sharers and recipients’ intention to use, recipients’ level of entertaining, as well as informative.
Context is significant to ratings of Attitude and Entertaining from recipients.
Stickers design with “Analogy” is perceived to be more exciting to receive than “Plaintext”.
Conclusion/Reflection
In the project, I explore design principles for incorporating self-tracked step counts in data-driven stickers as a first step towards integrating these data into Snapchat posts or Instagram Stories. I examine the effect of a sticker’s presentation style, domain-relevance, and background through surveys. We uncover the importance of domain-relevant backgrounds and stickers, identify the situational value of stickers styled as analogies, embellished, and badges, and demonstrate that data-driven stickers can make content more informative and entertaining.
Some limitations of the study: I only received valid answers from 19 participants. This means that our regression analysis results are highly troubled by sampling error. Thus, it is unlikely to draw statistically valid conclusion from such a small sample size. Another flaw in the analysis is that no interaction terms were included in the model, due to that our data sample were simply not powerful enough to discern any differences.
However, considering the pilot nature of the project, the process I took to reach these conclusions provided meaningful learning experience. Indeed, the learnings generated from this pilot directly influence the framing of research questions and analysis approach when the pilot was later developed into a larger, more comprehensive study with 506 total participants. The findings of the large-scaled study were published in Proceedings of the ACM on Human-Computer Interaction in October 2020.